Introduction
If you drop a steel nail into a bowl of water, it sinks like a stone. So how does a steel ship, which weighs much more than a tiny nail, float?

Figure 1. This photo shows a heavy steel ship floating on the ocean. (U.S. Navy, n.d.)
Over 2,200 years ago, a man Archimedes sat down in his bath, and figured out something that is still used in ship-making today—when you place an object in water, water moves out of the way—it gets displaced. If an object is floating, the amount of water that gets displaced weighs the same as the object. Think about how much water moves out of the way when you toss a basketball into a tub of water and it bobs around on top. What happens when you push down on that floating basketball and try to push it below the surface of the water, trying to push more water out of the way. It is hard to do, huh? It is like there is something pushing up against the ball, making it hard to force under the water.
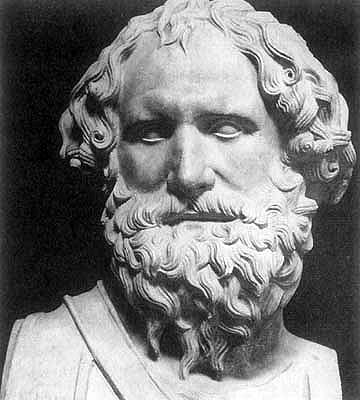
Figure 2. This photo shows a sculpture of the great Greek scientist Archimedes. (NASA, 2010.)
Archimedes discovered that there is a buoyant force that pushes up on an object when you place it in the water. The strength of this upward acting force is equal to the weight of the water that was moved out of the way. So, if the object that you place in the water moves just a little bit of water out of the way, the weight of that small amount of water is small, and so the buoyant force is small. If, on the other hand, the object displaces a lot of water, then there will be a large buoyant force pushing upward.
Whether an object sinks or floats depends upon its density compared to the density of water. Density is the mass per unit volume. In other words, it describes how much "stuff" is packed into a volume of space. Think of a rectangular kitchen sponge, which is airy and light, with lots of holes in it. Now imagine a block with exactly the same width, height, and depth as this sponge, but made out of solid metal. The block has a higher density than the sponge—there is more matterpacked into the same volume. The sponge will float, while the block will sink.
Ship-builders have figured out how to make steel ships float. They design the part of the ship that goes in the water, the hull, with a shape that displaces (pushes out of the way) a lot of water. This creates a large upward buoyant force. They also make the density of the ship lower than water by encasing air inside the hull. This trapped air lowers the density of the ship, so that it can float, just as air holes in a kitchen sponge give it a low density and allow it to float.
In this hydrodynamics (the study of fluid in motion) science project, you will work with a different kind of metal, called aluminum. You will gradually form different sizes of spheres (balls) out of the same piece of aluminum. The biggest sphere you will make—the one with the largest volume—will have a lower density than the smaller spheres, since the mass (the amount of aluminum) will be the same for all the spheres. So how much will you have to crush the aluminum ball before it sinks? Get your hammer ready to find out!
Terms and Concepts
- Buoyant force
- Density
- Mass
- Volume
- Matter
- Hull
- Aluminum
Questions
- What happens when objects are placed in water?
- How can you measure the strength of the lifting or buoyant force on an object in water?
- Why can steel ships float when a steel nail cannot?
Bibliography
At this website, you can read more about how Archimedes discovered his principle:
- NASA Quest. (n.d.). Eureka! The Story of the Archimedes Principle. Retrieved July 24, 2014, from http://quest.nasa.gov/aero/planetary/archimedes.html
This source explains why a steel ship can float, but a steel bar cannot:
- How Stuff Works, Inc. (2010). Why can boats made of steel float on water when a bar of steel sinks? Retrieved April 23, 2010, fromhttp://science.howstuffworks.com/question254.htm
In this video, you'll find out how to weigh an object, like a horse, using Archimedes' principle:
- ScienceOnline. (2009, August 23). Archimedes' Principle. Retrieved May 16, 2010, from http://www.youtube.com/watch?v=eQsmq3Hu9HA
Materials and Equipment
- Towel or paper towels
- Large clear bowl or container
- Tap water
- Heavy-duty aluminum foil
- Ruler, metric
- Pen
- Scissors
- Permanent marker
- Hammer or mallet
- Lab notebook
- Optional: Graph paper
Experimental Procedure
Preparing to Test
- Spread out the towel or paper towels on a hard work surface.
- Fill the bowl or container about two-thirds full of tap water and set it on the towels or paper towels.
- Using the ruler and a pen, measure out a square of aluminum foil that is 25 cm square.
- Feel free to use a slightly larger or slightly smaller square of aluminum foil in your experiment. Just be sure to write down the size of the aluminum foil you decided to use for all your trials in your lab notebook.
- Cut out the square of aluminum foil with the scissors.
- Repeat steps 3–4 until you have three equally sized square sheets of aluminum.
- For each aluminum sheet, create a data table in your lab notebook for testing, like Table 1 shown below for aluminum sheet 1. You should have three data tables—one for each aluminum sheet.
| Diameter (cm) | Sinks or Floats? | Amount of the Ball Under the Water (%) |
|---|---|---|
| 6 cm (example) | ||
| 5 cm | ||
| 4 cm | ||
| 3 cm | ||
| 2.8 cm | ||
| 2.5 cm | ||
| 2.2 cm | ||
| 2.0 cm |
Testing the Aluminum
- Mark the four corners of each sheet with permanent marker so you can spot the corners later.
- With your hands, pull the corners of one of the aluminum sheets together and crumple the sheet of aluminum into a loose ball that is approximately 6 cm in diameter. Use the colored corners as guides as you crumple the ball—this will be important in step 3.
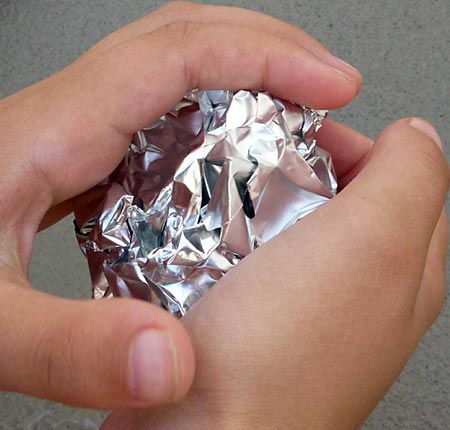
Figure 3. This photo shows how to crumple the foil into a loose ball.
- Measure the diameter of the aluminum ball with the ruler and record the exact measurement in your data table (it is ok if it is somewhat different from the example value in the data table).
- Read steps 3.a. and 3.b, then set the ball gently in the bowl of water and immediately write down in your lab notebook whether it sinks or floats.
- To avoid the ball filling up with water, since it does have some air pockets inside when it is loose, put the ball in the water so that the colored corners that you marked and brought together during crumpling are at the top of the ball.
- Record in your lab notebook whether the aluminum foil ball is floating on the surface, or if it is partially submerged (if part of it is below the water and part of it is on top).
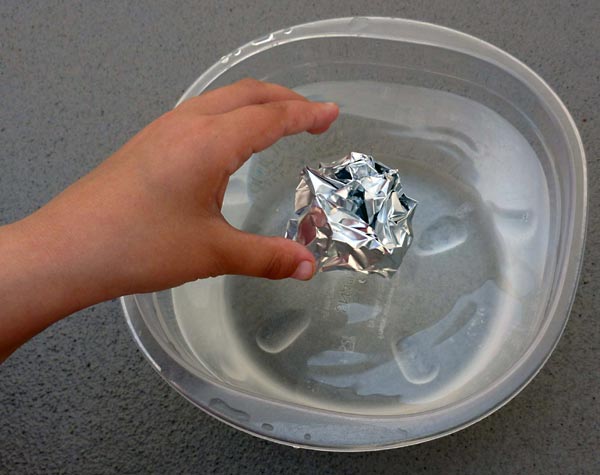
Figure 4. This photo shows how to gently place the foil ball in the water to test whether it sinks or floats.
- Get down low so that you are at eye level with the aluminum foil, and quickly record in your lab notebook approximately how much of the ball is below the top of the water, using Table 2 and Figure 5 as guides. Have an adult help you with this step, if necessary.
| Amount of Aluminum Ball Under Water | Percent to Record in Lab Notebook |
|---|---|
| A little | 10% |
| One-quarter | 25% |
| One-third | 33% |
| One-half | 50% |
| Two-thirds | 67% |
| Three-fourths | 75% |
| Almost completely | 90% |
| All | 100% |
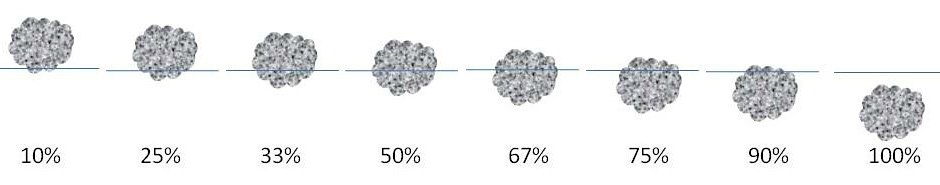
Figure 5. This drawing shows how to determine the approximate percentage of the foil ball that is submerged. The blue lines represent the water level.
- Remove the ball from the bowl of water, shake out any water, and dry it on the towel.
- Now crumple the same aluminum ball a little more tightly, into a smaller ball that is approximately 5 cm in diameter. If you crumple it too much, just carefully pull apart some of the aluminum foil to get the desired size.

Figure 6. This photo shows how to crumple the loose ball more tightly.
- Repeat steps 2–5.
- Crumple the aluminum ball more into an even smaller ball.
- If it is too hard for you to squeeze smaller, you can ask an adult for help.
- If it is too hard to squeeze smaller by hand strength alone, then use the hammer or mallet to gently pound the foil into a smaller ball on a surface that your parents say is okay to pound on. Use caution with the hammer or mallet so that you don't smash your fingers! It may be hard to get a perfect sphere (ball shape), but that is okay. Just approximate a sphere, and use the largest width of the aluminum that you can measure for your diameter measurement.
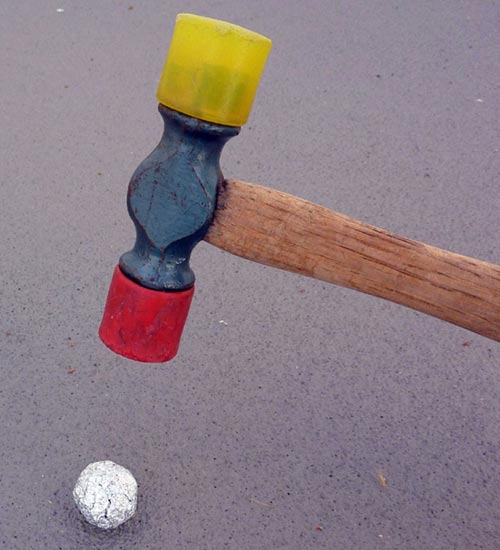
Figure 7. This photo shows how to pound the aluminum foil ball to make it into a smaller, denser ball.
- Repeat steps 2–5.
- Repeat steps 8–9 until the ball sinks.
- Repeat steps 1–10 for the other two sheets of aluminum foil, using the same diameters that you used in your first trial.
Analyzing Your Data Table
- Create a new data table, like the one below. Your diameters may be different from the examples shown. Enter the data from your three data tables into this new data table like Table 3 below.
| Diameter of Sphere (cm) | Aluminum Sheet 1 (% submerged) | Aluminum Sheet 2 (% submerged) | Aluminum Sheet 3 (% submerged) | Average Percent (%) |
|---|---|---|---|---|
| 6.0 (example) | ||||
| 5.0 | ||||
| 4.0 | ||||
| 3.0 | ||||
| 2.8 | ||||
| 2.5 | ||||
| 2.2 | ||||
| 2.0 |
- For each diameter in your data table, calculate the average percent submerged and record it in your data table. To get an average for one row in this data table, add up the three numbers in the row and then divide by three.
- Make a line graph showing the diameter of the aluminum balls on the x-axis and the average percentage of the balls that was submerged on the y-axis. You can make the graph by hand or use an online graphing program like Create a Graph to make your graph on a computer and then print it.
- At which diameter did the balls sink? At which diameter did the balls have the lowest density? At which diameter did the balls have the highest density? At which diameter did the balls have a density that was approximately equal to that of water (when was the ball almost completely submerged or submerged but not quite sinking to the bottom)?
No comments:
Post a Comment