Friday 29 May 2015

A Change in the Winds: Studying Bernoulli's Principle

Introduction

Have you ever wondered how airplanes are able to take off into the air and fly? Or why race cars have airfoils on their back sections? Both airplanes and race cars take advantage of Bernoulli's principle, also called the Bernoulli effect, to help control their movements. In the case of the airplane, it gets part of its lift from the Bernoulli effect. In the case of the race car, the Bernoulli effect helps to keep its wheels in contact with the racetrack at high speeds.
The Bernoulli principle describes the relationship between velocity and the pressure exerted by a moving fluid (liquid or air). It states that as the velocity of a fluid increases, the pressure exerted by that fluid decreases. One real-world example of this principle is when air is forced to move at a high speed from a tube, such as a hair dryer or leaf blower. In the region where the air is moving, the Bernoulli principle indicates that the pressure is lower than in the surrounding stationary air. If you have a region of low pressure near a region of high pressure, air will move into the region of low pressure. The air moves because the force of the low-pressure region is less than that of all other forces acting on the air. See Figure 1, below.
In this science fair project, you will observe the forces acting on the air by watching two light objects (soda cans) move toward the air flow. You will change the speed of the airflow and the distance between the two cans to see what happens to the objects. How do both speed and distance work with the Bernoulli effect? Does a higher speed make them fly together sooner? Does a greater distance make them come together more slowly?
Aerodynamics Science Project handdrawn Bernoulli principle
Figure 1. An increase in air velocity between the cans weakens the air pressure between them, causing them to be pushed together.

Terms and Concepts

  • Bernoulli's principle, or the Bernoulli effect
  • Velocity
  • Pressure, specifically air pressure
  • Fluid
  • Force

Questions

  • What is Bernoulli's principle?
  • What are some real-world applications of Bernoulli's principle?
  • Why would an object move when the pressure on one side is lowered?

Bibliography

This website offers a good explanation of air pressure, also known as atmospheric pressure:

Materials and Equipment

  • Soda cans, emptied and rinsed out (2)
  • String, several feet
  • Scissors
  • Clear tape, or masking tape
  • Ruler, preferably metric
  • A helper (optional)
  • Hair dryer or small, strong fan with more than one speed setting
  • Ruler
  • Stopwatch
  • Lab notebook
  • Graph paper

Experimental Procedure

In this experiment, you will be hanging two empty soda cans in midair and blowing air between them to see what happens when air pressure changes. Why do you think that the cans are hung instead of set on a table?
  1. Find a place to hang the cans in your house, such as from a loft or from a non-sloping ceiling. It should also be near an electrical socket. Cut several feet of string for each can, so when they are hung, they are at about chest level for you.
  2. Bend each can's tab so that it is vertical (see Figure 2), and then tie a piece of string to each one.
    Aerodynamics Science Project hanging cans with top of tin can bent
    Figure 2. The tabs of these cans have been bent vertically so that they will hang properly.
  3. You might want a helper to assist you with this step. Hang the two cans with tape so that they are level with each other. There should be 12 cm between the taped ends of the string (see Figure 3, below) and they should be at your chest level as they hang. Make sure that you can easily access the taped parts of the strings because you will be moving them farther apart as you test Bernoulli's principle, so will need to measure and record the changing distances. Note: You might need a helper who can stand on a chair to tape the string to the ceiling or high location and continue to do so throughout the experiment. Use caution if you are using a ladder or chair to stand on.
    Aerodynamics Science Project distance between cans
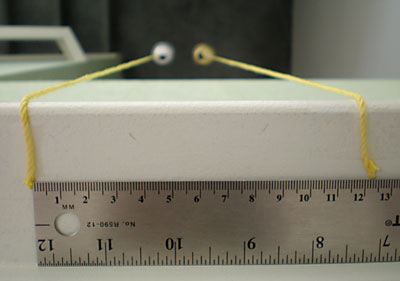
    Figure 3. These cans were hung from a loft by a staircase. From this view, you can see the distance between the strings, and the cans hanging on the first floor.
    In the following steps, you will be using air pressure to move the objects. The region between the two cans will be the low-pressure region, and everywhere else around each can will be a high-pressure region. The difference in pressure between the cans will cause the cans to move because the higher pressure outside the cans is a stronger force than the low pressure between the cans. Ultimately, this pushes them together. By blowing the air, you're not pulling the objects closer, you're weakening the air pressure that keeps them separated.
  4. Have your stopwatch ready and your hair dryer plugged in. You will start the stopwatch when you turn on the hair dryer and stop it when the cans collide. You might want to have someone help you—have the helper use the stopwatch while you use the hair dryer. Make sure the hair dryer is set to its lowest speed setting.
  5. Aim the hair dryer directly between the two cans and turn it on (see Figure 4, below). You might need to practice positioning the hair dryer to get the cans to collide a few times before you have your partner use the stopwatch. You'll probably find that it's easy to blow one can around, but you need to focus on blowing air between them. This can be tricky, especially at the lowest hair dryer speed. If the speed doesn't seem to work no matter how many times you practice, just use the next highest speed setting. Once you find the right position, measure and record the distance from the tip of the hair dryer to the cans in your lab notebook.
    Aerodynamics Science Project aiming the hairdryer between cans
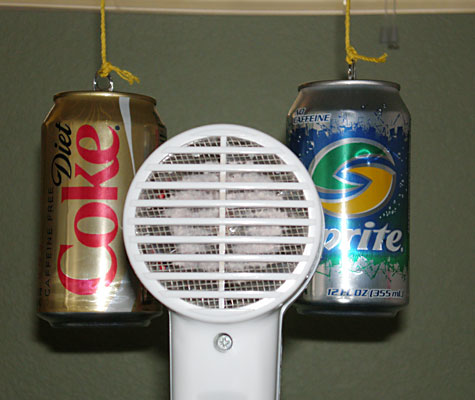
    Figure 4. This is the proper way to aim the hair dryer—exactly between the two cans.
  6. After you finish practicing, it's time to begin collecting data. Make a data table in your lab notebook, with a column labeled Separation Distance (beginning with 12 cm) and a corresponding column labeled Time. Get the hair dryer in the position you practiced with, aim the hair dryer properly, and turn it on at the same time the stopwatch is started. Stop the hair dryer when the cans first hit each other. Record the time in your data table.
  7. Repeat step 6 two more times, using the same distance between the objects and the hair dryer each time. Later, you'll find an average of the data to put in a graph. Finding averages of multiple trials is more accurate than using only one trial—what if you only did it once and made a mistake?
  8. Now change the distance between the two soda cans and record the distance in your lab notebook. This is done by taking one string off of wherever it is hung and increasing the distance by 1 cm, and reattaching it with the same piece or a new piece of tape. There should now be 13 cm between the strings.
  9. Keep the hair dryer on the same speed and repeat step 6 two more times, recording the information in your data table.
  10. Continue increasing the distance by 1 cm and test each new distance three times. Do this until the distance is so great that the cans no longer collide when air is blown between them.
  11. Calculate an average time value for each distance. Then make a graph with all of the averages, where the x-axis is Separation Distance (in cm), and the y-axis is Time (in sec). This graph represents data for the hair dryer speed setting you used.
  12. Now it's time to change the speed. Make a new data table in your lab notebook to record the information for this new speed setting.
  13. Your hair dryer should have more than one speed setting, such as low and high. Change the speed to the next highest one (if there is a next highest setting) and perform steps 3-11. Make sure you use all the same distances that you used in the previous experiment. Start with a soda can separation distance of 12 cm and increase by 1 cm until the cans no longer collide. Perform three trials for each distance. If there are more than two settings on your dryer (like low, medium, and high), then make sure to test all of them and make a graph for each one. What do the differences in the graphs mean? What do they tell you about air pressure and Bernoulli's principle?

Monday 25 May 2015

The 'Ultimate' Science Fair Project: Frisbee Aerodynamics

Introduction

Tossing a Frisbee with your friends is a great way to have fun in the sun. As you practice your throws and become more accurate, you are learning about theaerodynamics of Frisbee flight intuitively. You are learning the body mechanics that will make the Frisbee go where you want it to go. This science project will get the thinking part of you into your Frisbee tossing. Who knows, it might even help you get better!
Aerodynamics project Throwing frisbee
Figure 1. Tossing a Frisbee with friends can be a lot of fun, and can be a great way to learn more about aerodynamics! (Louis Desroches)
Two key forces that act on a Frisbee during its flight are lift and drag. Lift is the force that allows a Frisbee to stay in the air, and it opposes the force of gravity on the mass of the Frisbee in flight. The Frisbee itself creates this lift force as it flies through the air. As the frisbee flies along, it deflects some air downward. Since every action must generate an equal and opposite reaction (Newton's third law of motion), this means that the air pushes back up on the frisbee, generating lift.Drag is a backward force on the Frisbee, and it goes against the Frisbee's movement through the air. The force of drag acts perpendicular to the force of lift. Figure 2 below shows how lift and drag act on a Frisbee. The NASA websites listed in the Bibliography are a great place to start learning more about the concepts of lift and drag, including explanations of some common misconceptions about how lift is generated.
The forces acting on a frisbee in flight (lift, drag and weight) and their relationship to the direction of flight and the disk angle.
Figure 2. This diagram shows the forces on a Frisbee in flight. The arrow v shows the direction of flight (v stands for velocity). The downward arrow mg is the weight of the Frisbee (mass times gravity). The backward arrow, D, is the force of drag. The upward arrow L is the force of lift. It acts perpendicular to the direction of flight and drag. Both lift and drag change as a function of the angle of attack, α, of the disc, shown here as the difference between the direction of flight (v) and the direction the Frisbee is pointing (d1). (Hubbard and Hummel, 2000)
You will notice in the diagram above that the Frisbee can travel at an angle. This can be caused by throwing the Frisbee at an angle. That is, at the moment when you snap your wrist and let go, the Frisbee can be tilted with respect to the ground. We will assume that the moment you throw the Frisbee, it will be pointed in the same direction it is moving — meaning the d1 and v arrows in Figure 2 are perfectly lined up with each other (and the angle of attack, α, is zero). In this project, we will call the frisbee's tilt relative to the ground right when it is thrown the launch angle. Figure 3 below illustrates the launch angle.
launch angles for throwing a frisbee
Figure 3. An illustration of a Frisbee's launch angle. In the figure, the Frisbee is being thrown to the right. If the front edge of the Frisbee is tilted up, the launch angle is positive. If the Frisbee is horizontal (parallel to the ground), the launch angle if zero. If the front edge of the Frisbee is tilted down, the launch angle is negative.
As a side note, you have probably noticed that a Frisbee does not travel far if it is thrown without spin. Spinning the Frisbee helps it fly by supplying angular momentum, which keeps the Frisbee stable while it is rotating. The faster the Frisbee spins, the more stable it should be.
How do you think the launch angle will affect a Frisbee's flight? Would you want to use a different launch angle to make a short pass to a nearby friend, than a long pass to someone all the way across a field? In this project, you will test how the launch angle affects the distance of a Frisbee's flight, and use this knowledge to predict the flight of a Frisbee based on its launch angle.

Terms and Concepts

  • Aerodynamics
  • Forces
  • Lift
  • Gravity
  • Air pressure
  • Drag
  • Launch angle
  • Angular momentum

Questions

  • What are the forces acting on a Frisbee in flight?
  • Can you think of other devices in which angular momentum is important for them to function?
  • How do you think the launch angle of the Frisbee affects the distance of flight?

Bibliography

The National Aeronautics and Space Administration (NASA) website has a great section on Aerodynamics. Even though there is not anything specific on Frisbee flight, you can still learn a lot about how Frisbees fly by learning about aerodynamic forces on other types of airfoils. Check out the sections on gliders, the lift simulator program, lift, and drag.
There are some very common misconceptions about how lift is generated. See the following NASA page for explanations of why some of these popular theories are incorrect.

Materials and Equipment

  • Tape measure
  • String, chalk, or a hose
  • Frisbee
  • Optional: Masking tape and marker
  • Optional: Helper (for measuring and throwing back the Frisbee)
  • Optional: Video camera and a second helper to run it
  • Lab notebook

Experimental Procedure

  1. Do your background research and learn about the forces on the Frisbee in flight.
  2. Use string, chalk, or a hose to make a center line for aiming your throws. The length of the line will depend on how far you think you can throw a Frisbee, but several meters is a good starting point.
  3. Practice throwing the Frisbee down the center line a few times so you get used to tossing it.
    1. If you have not thrown a Frisbee much before, you may want to try practicing it for a little while.
    2. Tip: A good way to throw a Frisbee is by standing sideways with the Frisbee held in front of you (near your other shoulder), then bringing the Frisbee horizontally across you as you throw it.
    3. c. Also practice throwing the Frisbee just as hard (with the same amount of effort) each time. If you throw the Frisbee really hard sometimes, but really softly other times, this will affect your results.
  4. If your tape measure is not as long as your typical Frisbee throw, you can make a longer tape measure using a piece of string. Mark off regular intervals with tape labels and a marker, and you are in business.
  5. Throw the Frisbee as flat and horizontal as you can, aiming it down the center line. When the Frisbee lands, measure the distance between the launch point and the Frisbee's landing point (where it first hit). You can use a helper to help you collect this data. Record this data in your lab notebook.
    1. If you have a video camera, you can use it to help you analyze the launch angle of the Frisbee. Set it up near you so that it can record your throw without your body blocking the view. Later you can watch and stop the video at the moment that you release the Frisbee and measure the launch angle of the Frisbee. See the Make It Your Own tab for suggestions on how to do this in more detail.
    2. If you do not use a video camera, then you or a helper will have to watch closely and estimate the launch angle for each throw. Here is one method you can try: Hold one arm out horizontally and use the other arm to try to match the launch angle that you saw. You can have a helper use a protractor to measure the angle between your arms.
    3. If there is wind, note the wind speed and direction in your notebook.
    4. If you clearly made a mistake on the throw (for example, if the release was way off the center line) then do not include it in your results.
  6. Repeat step 5 at least nine more times, making a total of at least ten good throws thrown from the horizontal angle.
    1. Try your best to throw with similar arm motion and speed, and impart a similar spin on the Frisbee each time. You want to have the same release point so that your arm is directed along the center line for each launch.
    2. For each throw, be sure to measure and record the results.
  7. Repeat steps 5-6 but try throwing the Frisbee with two different positive and two different negative launch angles (refer to Figures 3 in the Introduction for a reminder about what positive and negative launch angles mean). Make at least ten good throws at each of the four of these launch angles.
    1. To measure the effect of launch angle on Frisbee flight, you will need to try your best to keep all other aspects of the flight the same, as described in step 6a. The one thing you want to vary is the launch angle.
    2. For each throw, be sure to measure and record the results.
  8. When you are done collecting your data, average your results (the distance and direction) for each launch angle.
  9. Make a graph with flight distance on the y-axis and launch angle on the x-axis.
  10. Is there a relationship between launch angle and distance?
  11. Can you explain your results in terms of the aerodynamic forces on the Frisbee?

Tuesday 19 May 2015

The True Cost of a Bike Rack: Aerodynamics and Fuel Economy

Introduction

If you are a big fan of car racing, you probably know that race cars can zoom around the track at speeds of over 200 miles per hour (mph). At such high speeds, a car's engine must work very hard to overcome lots of air resistanceAir resistance (also commonly referred to as drag) is a force that acts on a car opposite its direction of motion. Air resistance occurs because the car (or any moving object) has to push a lot of air out of the way in order to move forward. Air resistance is always opposite to the direction of motion, and it gets stronger as the car moves faster. In other words, when a car moves forward, air resistance tries to slow it down. The faster the car moves, the more air resistance it encounters, as shown in Figure 1, below.
air resistance on a carFigure 1. Air resistance is always in the opposite direction a vehicle is moving. As a car's speed increases, so does the air resistance (image adapted from Ebaychatter0, Wikimedia Commons, 2012).
Race car drivers want to minimize the air resistance on their cars, because air resistance slows them down. This is why race cars are designed to be veryaerodynamic, meaning they have very little air resistance. While normal drivers are not concerned about the need to drive at speeds of 200 mph, they also want to minimize air resistance, because it will help improve the car's fuel economy. You may have heard adults talking, or seen commercials, about cars that "get good gas mileage" or "have a good fuel economy," but what exactly does this mean? Fuel economy is a measure of how far, on average, a car can travel using a certain amount of gasoline. In the U.S., it is measured in miles per gallon, or mpg for short. So, for example, if a car "has a fuel economy of 30 mpg," that means, on average, it can drive 30 miles on 1 gallon of gasoline. Fuel economy tends to be better if you are driving at a steady speed (like on a highway), and worse if there are lots of sudden starts and stops (like in a city with lots of red lights), so cars are usually rated separately for their highway fuel economy and theircity fuel economy.
In this sports science project, you will investigate how air resistance affects the fuel economy of a car. You will measure the fuel economy of a car without a roof rack, and then with a roof rack added, which will increase the air resistance on the car. Do you think adding a roof rack to a car will have an impact on its fuel economy? If so, how big do you think the difference will be? Do you think you will be able to measure a decrease in fuel economy, or will it be too small to notice?

Terms and Concepts

  • Air resistance
  • Drag
  • Force
  • Aerodynamic
  • Fuel economy
  • Miles per gallon (mpg)

Questions

  • What are some typical fuel economies for different types of vehicles, such as a large pickup truck or SUV versus a small hybrid sedan? See the Bibliography below for some references to look up fuel economies.
  • How different are the city and highway fuel economy ratings for most vehicles?
  • Which is more aerodynamic, a small sports car or a large pickup truck?
  • How much of an impact do you think air resistance from a roof rack will have on fuel economy? Will it be a large effect or barely noticeable?
  • How do you think other factors can affect fuel economy?
    • For example, how could weather conditions like wind, rain, or snow affect fuel economy?
    • What about the amount of weight the car is carrying or towing? How would adding more passengers or cargo to a car affect its fuel economy?

Bibliography

Materials and Equipment

  • Adult volunteer with a valid driver's license and who is allowed to drive a car
  • Car with detachable roof rack, like those used for bikes, skis, or luggage. Many different types of roof racks and luggage racks are available fromAmazon.com. Have an adult help you pick a roof rack that will fit on the car you will use for the experiment.
  • Lab notebook
Disclaimer: Science Buddies occasionally provides information (such as part numbers, supplier names, and supplier weblinks) to assist our users in locating specialty items for individual projects. The information is provided solely as a convenience to our users. We do our best to make sure that part numbers and descriptions are accurate when first listed. However, since part numbers do change as items are obsoleted or improved, please send us an email if you run across any parts that are no longer available. We also do our best to make sure that any listed supplier provides prompt, courteous service. Science Buddies does participate in affiliate programs with Amazon.comsciencebuddiesCarolina Biological, and AquaPhoenix Education. Proceeds from the affiliate programs help support Science Buddies, a 501( c ) 3 public charity. If you have any comments (positive or negative) related to purchases you've made for science fair projects from recommendations on our site, please let us know. Write to us at scibuddy@sciencebuddies.org.

Experimental Procedure

  1. Note: For convenience when doing the experiment, this procedure is written using miles (mi) per gallon (gal), or mpg, to measure fuel economy. However, science is done in metric units, so you may need to convert your results to metric units when writing up your procedure and for your science project display board. In the metric system, fuel economy is measured in kilometers per liter, or kpl. If you do not know how to convert between English and metric units, you can use an online unit conversion tool to do this.
  2. The objective of this experiment is to compare the fuel economy of a car with and without a roof rack. In order to do so, you will need to plan out the driving routes your adult volunteer will use.
    1. When the government does fuel economy tests, they are done in a carefully controlled laboratory environment. This lets government scientists control all the variables in their experiment. For example, they do the tests indoors to eliminate variables like wind, rain, and traffic. You can read more about how cars are tested at How Vehicles Are Tested. However, you will be doing the experiment in real-world driving conditions, which can be subject to changes in weather, traffic patterns, and other factors out of your control. This means that you need to do your tests over a long enough period of time for the effects of all of these variables to average out. You should do a minimum of 2 hours of total driving time for each test (one without the roof rack and one with the roof rack). You will need to pick the same driving route to use for each period. Here are some suggested ways to test for that length of time:
      1. If your adult volunteer drives to work every day (or has another consistent commute, like dropping kids off at school or picking them up at sports practices), you could have him or her commute without the roof rack one week, and with the roof rack the following week. Try to make sure the commute is at least 12 minutes in each direction, which would result in a total commuting time of 2 hours for a 5 day work week (a longer commute is even better).
      2. You could make two long trips to a destination about an hour away. Make one complete 2 hour roundtrip without the roof rack, and one complete roundtrip with the roof rack.
    2. Because you cannot do your tests in a laboratory environment, you will need to do your best to control variables like traffic, weight, and weather.
      1. Do not compare two testing periods with very different weather conditions. For example, do not compare a clear, sunny week (or single 2 hour trip) to a rainy, windy week (or single 2 hour trip). You may need to look at the weather forecast in advance to help plan your experiment.
      2. Do not compare two testing periods with very different traffic conditions. If your adult volunteer is commuting for 5 days for each test, it is okay if he or she consistently gets stuck in traffic every day during the commute. If there usually is not a lot of traffic, it is also okay if he or she gets stuck in traffic only once or twice (for example, due to an accident). However, do not compare an entire week of no traffic to an entire week with lots of traffic (for example, if there is a new construction project along his or her commute). If you are doing a long trip, you can check an online traffic app in advance to try and avoid traffic.
      3. Do not compare two testing periods when a lot of extra driving is done with the car during one, but not during the other. For example, if you typically make one trip to the grocery store and three trips to soccer practice throughout the week, it is okay to do that for both weeks. However, you should not compare one week where the car is only used to commute, to another week where the car is used to commute andto run errands every day. The trips during both testing periods do not need to be exactly the same, but should be as similar as possible.
      4. Make sure you have similar amounts of weight in the car for both tests. This includes the total weight of all passengers, cargo, and towing objects (if any). It is OK if you occasionally have extra passengers in addition to the driver, or consistently have extra passengers all week. But do not compare one week with no passengers or cargo to another week with four passengers and a lot of cargo.
      5. Remember to make sure you take as similar a route as possible for each half of the experiment. For instance, do not compare two weeks when your adult volunteer commutes to very different locations, or two roundtrips to different destinations.
      6. If you do a long roundtrip route, make sure you do a complete roundtrip without the roof rack, and another complete roundtrip with the roof rack. Do not test without the roof rack one way and with the roof rack on the return trip. This is because differences in elevation between two locations (and driving uphill or downhill between them) can have a big impact on fuel economy.
  3. In your lab notebook, make a data table like Table 1, below, in which to record the results of your experiment.
    1. Note: Some newer cars have a dashboard display that shows the car's current fuel economy in mpg. Usually the fuel economy measurement resets when you reset the trip odometer. If your car is equipped with this feature, you can use it to measure fuel economy for your experiment, but you should still do the calculation by hand, as described below.
 Without the Roof RackWith the Roof Rack
Starting fuel as a fraction of the total tank  
Ending fuel as a fraction of the total tank  
Starting fuel (gal)  
Fuel added (gal)  
Ending fuel (gal)  
Total fuel used (gal)  
Total distance driven (mi)  
Fuel economy according to your calculations (mpg)  
Optional: Fuel economy according to car's dashboard display (mpg) (if available)  
Table 1. Data table for recording the results of your experiment. The last row is optional, depending on whether or not your car displays fuel economy on the dashboard.

  1. Once you have discussed your plan with your adult volunteer, start your experiment and record your data. First you will measure fuel economy without the roof rack.
    1. Note: It will be easier to record the initial fuel level if you start the experiment with a full tank of gas. This is recommended, but not required.
    2. On the first day of your experiment (or at the beginning of your long trip), have your adult volunteer reset the car's trip odometer to zero.
    3. In your data table, record the starting level of the fuel tank as a fraction (for example, "3/4"). If the gas tank is full, the value is just "1".
      1. If necessary, have an adult help you estimate the gas tank level. For example, if the needle is halfway between the ½ and ¾ marks, then the tank is ⅝ full. This value will affect the fuel economy you calculate at the end of the experiment, so try to be as accurate as possible.
    4. Have your adult volunteer drive the car through the planned route for the experiment (this may take up to a week, depending on your plan).Important: Make sure your volunteer keeps all receipts for filling up the car with gasoline. You will need to know how much gasoline has been added to the fuel tank throughout the experiment.
    5. On the final day of the experiment (or at the end of your trip), record the trip odometer distance (the distance driven, in miles) and the ending fuel tank level in your data table.
      1. Again, if necessary, have an adult help you estimate the fuel tank level. Be as accurate as possible.
    6. Use the receipts to add up the total amount of gasoline that was put in the tank, and enter this value in your data table.
  2. Calculate the car's fuel economy without the roof rack.
    1. First, you will need to convert the fractional fuel tank amounts (starting and ending) to gallons, and enter these values in your data table. To do this, you will need to look up the size of your car's fuel tank. You can find this information in the owner's manual (ask an adult for help if necessary). Multiply the starting fraction by the fuel tank's capacity to calculate the amount of fuel in gallons.
      1. For example, a 12 gal fuel tank that is ¾ full has 9 gal of gasoline in it.
    2. Next, you need to calculate the total amount of fuel used, and enter this value in your data table. To do this, add together the starting fuel and the amount of fuel added, then subtract the ending fuel (all in gallons, not fractions).
      1. For example, if the tank started out with 9 gal. of gasoline, your adult volunteer added 10 gal. total throughout the experiment, and the tank ended with 3 gal., then you used a total of 9 + 10 - 3 = 16 gal of gasoline.
    3. Finally, calculate the car's fuel economy in mpg using Equation 1:Equation 1:
      FuelEconomy(mpg)=Totaldistancedriven(mi)Totalfuelused(gal)
      1. For example, if the car that used 16 gal of fuel drove a total of 400 mi, then it had a fuel economy of 400/16 = 25 mpg.
    4. Optional: If your car displays fuel economy on the dashboard, check the value (have your adult volunteer help you if necessary) and record it in your data table. Compare this value to the one you calculated using Equation 1. Are they very similar?
  3. Repeat steps 4–5 with the roof rack installed.
    1. Remember to reset the trip odometer before you start the second half of your experiment.
    2. Remember to keep track of the fuel tank levels and fuel added in the second column of your data table. Be careful not to get gasoline receipts from the first half of your experiment mixed up with those from the second half.
  4. Calculate the percentage change in fuel economy from driving the car without the roof rack to driving it with the roof rack by using Equation 2:Equation 2:
    %changeinfueleconomy=fueleconomywithroofrack(mpg)fueleconomywithoutroofrack(mpg)fueleconomywithoutroofrack(mpg)×100
  5. Analyze your results.
    1. How much did fuel economy decrease when you added a roof rack? How does this compare to your prediction?
    2. Based on your results, would you recommend leaving a roof rack installed on a car when it is not actually in use? Why or why not?
    3. In the Introduction you learned that air resistance increases as a car's speed increases. Presumably, your adult volunteer did this experiment at typical "safe" driving speeds and followed the speed limit—usually no higher than 65 miles per hour (mph). But, some race car drivers can reach speeds of over 200 mph. How much more of an effect do you think air resistance has at 200 mph instead of 65 mph? How much of an impact would this have on fuel economy?