Friday 24 July 2015

How Does a Hovercraft Work?

Introduction

hovercraft is a vehicle that glides over a smooth surface by hovering upon an air cushion. Because of this, a hovercraft is also called an Air-Cushion Vehicle, or ACV. How is the air cushion made? The hovercraft creates vents or currents of slow-moving, low-pressure air that are pushed downward against the surface below the hovercraft. Modern ACVs often have propellers on top that create the air currents. These currents are pushed beneath the vehicle with the use of fans. Surrounding the base of the ACV is a flexible skirt, also called the curtain, which traps the air currents, keeping them underneath the hovercraft. These trapped air currents can create an air cushion on any smooth surface, land or water! Since a hovercraft can travel upon the surface of water, it is also called an amphibious vehicle. Figure 1 below shows a picture of a modern hovercraft and a diagram showing how the air vents create the air cushion.

hovercraft        air vents

Figure 1. This image on the left shows a modern style hovercraft which carries passengers over the surface of the water, while the diagram on the left shows how the air vents moving through the hovercraft create the air cushion below the craft for movement using the following labels: 1) propellers, 2) air currents, 3) fan, and 4) flexible skirt. (Wikipedia, 2007)

How does the air cushion beneath the hovercraft allow the vehicle to glide to freely? The key to the ease of movement is reducing friction. A simple way to think of friction is to think about how things rub together. It is easier to rollerblade on a smooth sidewalk than a gravel path because the sidewalk has less friction. The wheels of the rollerblade do not rub as much against the sidewalk as they do all the pieces of gravel on the path. Similarly, the air cushion beneath the hovercraft greatly reduces the friction of the vehicle, allowing it to glide freely upon the land or water below.

In this aerodynamics and hydrodynamics science project, you will build your own mini hovercraft using a CD or DVD, pop-top lid from a plastic drinking bottle, and a balloon. The balloon will create the air currents the hovercraft needs to work. These air currents will travel through the pop-top lid and go beneath the hovercraft. You will fill the balloon up with different amounts of air to test if more air will cause the hovercraft to travel for longer periods of time. A balloon blown up with a lot of air will provide a large volume of air, and a balloon blown up with less air will provide a smaller volume of air. Will a balloon with a large volume of air make the hovercraft travel longer than a balloon with a smaller volume of air?

Terms and Concepts

  • Hovercraft
  • Air cushion
  • Friction
  • Volume

Questions

  • How does a hovercraft work?
  • How do the air currents in a hovercraft reduce friction?
  • Do you think the volume of air in a balloon-powered hovercraft is important for how long the hovercraft can hover?

Materials and Equipment

  • Pop-top lid from a plastic drinking bottle, sometimes found on reusable plastic drinking bottles. Alternatively, a male straight valve with the dimensions 3/8-inch OD x 3/8-inch MPT (PL-3042) can be used. This valve is available at some hardware stores
  • An old CD or DVD that you do not mind destroying
  • Craft glue, like Elmer's® Craft Bond Tacky Glue, or epoxy that works with plastics, like Elmer's® Super Fast Epoxy Cement. If you use a pop-top lid you can use either the craft glue or epoxy, but if you use the straight valve you should use epoxy.
  • Medium-size balloons (should be able to inflate up to at least 11 inches)
  • Optional: Balloon pump
  • Stopwatch
  • Large flat surface for testing the hovercraft
  • Lab notebook

Wednesday 15 July 2015

Green Technology: Build an Electronic Rain Detector to Conserve Water

Introduction

You might already know that conserving water is a good idea, but what exactly are the benefits of water conservation? One benefit is energy conservation. Water-pumping, delivery, and wastewater-treatment facilities consume a significant amount of energy. In some regions of the world (like California) over 15 percent of total electricity consumption is devoted to water management. Saving water conserves this energy for other uses. Another benefit is habitat conservation. Overuse of fresh water can lower the levels of lakes and rivers, causing significant environmental problems. Minimizing human water use helps preserve freshwater habitats for local wildlife and migrating waterfowl, as well as reduces the need to build new dams and other water-diversion infrastructures.
There are few things as wasteful as a water sprinkler system running during a rain storm. The goal of this environmental engineering science project is to build an electronic circuit that can detect when it is raining and that can shut off the power to an automatic sprinkler system.
The circuit will be modified from an example in an electronics kit, making it relatively easy to build. The circuit contains an electronic part called a 4011 integrated circuit (IC). The 4011 IC has four nand gates (the word nand is derived from "not and," reflecting the fact that the "nand" output is the reverse of the "and" output). You will just be using one of them for this science project. A nand gate is able to turn things on or off, depending on the kind of input it receives. The nand gate has two inputs, labeled 1 and 2 in Figure 1, below. The input is "on" when it is at 9 volts (V) and "off" when it is connected to ground. 
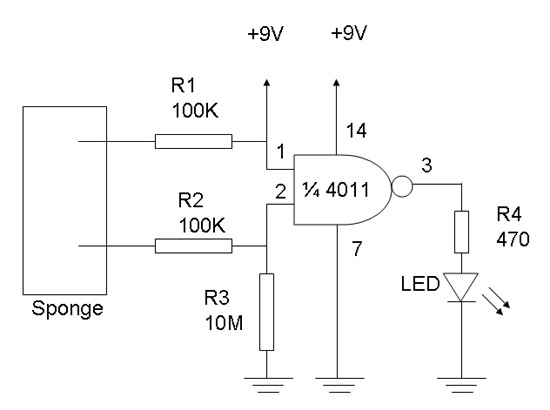
Electronics and Electricity science  project <B>Figure 1.</B> A rain detector circuit.
Figure 1. A rain detector circuit. When the sponge is wet, no current flows from input 3 to ground, so the circuit shuts off power. When the sponge is dry, the circuit allows current to flow through the LED to ground (the LED is a substitute for the sprinkler; when it is on or off, the sprinkler would be on or off). The circuit "senses" rain because there is an electrical connection between the wires when the sponge is wet. When this electrical connection is made (when the sponge is wet) the voltages at inputs 1 and 2 become high (9 V, "on") and output goes to 0 ("off"). To turn off a sprinkler system, the power that controls the sprinklers would be connected through the circuit.
Here is how the output is controlled by the two inputs. When inputs 1 and 2 are both at 9 V (that is, 1 and 2 are both "on"), the output from input 3 is "off." For all other combinations of the states of inputs 1 and 2 (off/off, on/off, off/on) the output from input 3 is "on" (9 V). You can put this relationship in a truth table, as shown below.

123LED lights upRain
OnOnOffNoYes
OnOffOnYesNo
OffOnOnYesNo
OffOffOnYesNo
Table 1. Truth table for the nand gate. The output (3) is "off" (0 V) only when both inputs (1 and 2) are "on" (9 V). This is the opposite of an "and" gate truth table, where the output is "on" only when both 1 and 2 are "on." The table could also use "high" vs. "low", or "1" vs. "0," rather than "on" vs. "off."
This science project involves making the circuit shown in Figure 1 and demonstrating that it shuts off power to the light-emitting diode (LED) when the sponge is wet. The LED represents the sprinkler system. If you choose, you can add the circuit to a real sprinkler system (see the Variations). In an automatic sprinkler system, the water is turned on and off by a solenoid. When the solenoid is powered by a voltage, a part (called a diaphragm) moves so that the water can flow. When the power is turned off, the part falls back to its original location and the water flow is blocked.
The circuit will be modified from a circuit that turns off the power when a touch sensor is touched. For this engineering science project, the touch sensor will be replaced with a "water sensor" in the form of a sponge. If the circuit were used outside, the wet sponge would keep the power off until it was allowed to dry out. It is important to note that the circuit allows electricity to flow only when two conditions are met: the power switch is "on" (as it would be when the sprinkler system is turned on) and the water detector does not sense water. In the circuit, turning the power on just means moving the power switch to the "on" position. For a sprinkler system, the power would most likely be turned on by a timer. When the water sensor is wet in a sprinkler system, the electricity is not allowed to flow, even when the power is turned on.

Terms and Concepts

  • 4011 integrated circuit
  • Nand gate
  • Ground, in circuitry
  • Truth table
  • Light-emitting diode (LED)
  • Solenoid

Questions

  • How much water does the average household use per day?
  • What are some reasons to conserve water?
  • How many nand gates are in the 4011 IC?
  • What does the truth table for an "or" gate look like?
  • How can you combine nand gates to make an "or" gate?

Materials and Equipment

Note: this project was originally based on the Radio Shack Electronic Sensors Lab kit, which is no longer available. If you have experience working with circuits, you should be able to assemble the circuit based on Figure 1 in the introduction. We have provided links to purchase the individual circuit parts below.

Experimental Procedure

Note: This engineering project is best described by the engineering design process, as opposed to the scientific method. You might want to ask your teacher whether it's acceptable to follow the engineering design process for your project before you begin. 
  1. Assemble your circuit based on the breadboard diagram in Figure 2.
    1. If you do not know how to use a breadboard, see the How to Use a Breadboard tutorial from SparkFun Electronics.
    2. If you know how to read a circuit diagram, you can assemble your circuit based on Figure 1 in the introduction instead. See the How to Read a Schematic tutorial from SparkFun Electronics to learn about reading circuit diagrams.
    3. Connect the red and black wires from the battery holder to the breadboard's positive (+) and ground (-) buses respectively.
    4. Insert the 4011 chip into rows 1–7, so it straddles the gap in the middle of the breadboard.
      1. Note: the chip's pins are numbered from 1–14, starting in the upper left and going counterclockwise.
    5. Use a jumper wire to connect pins 1 and 14 to the breadboard's positive bus (although red is traditionally used to represent positive in electronics, you do not have to use a red wire if your kit does not have a red wire of the right size).
    6. Use a jumper wire to connect pin 7 to the ground bus (although black is traditionally used to represent ground in electronics, you do not have to use a black wire if your kit does not have a black wire of the right size).
    7. Use the 10 MΩ resistor (brown, black, blue, and gold stripes) to connect pin 2 to the ground bus.
    8. Use the 470 Ω resistor to connect pin 3 to row 10 on the breadboard.
    9. Use the LED to connect row 10 on the breadboard to the ground bus. The LED's long leg should go in row 10, and the short leg should go in the ground bus.
    10. Connect one lead of a 100 kΩ resistor to pin 1, and leave the other end free.
    11. Connect one lead of a 100 kΩ resistor to pin 2, and leave the other end free.
    12. Your completed circuit should look like the one in Figure 3.
breadboard diagram for rain detector circuit
Figure 2. A breadboard diagram for the rain detector circuit.


prototype of a rain detector circuit
Figure 3. A completed rain detector circuit.
  1. When you have completed assembling the circuit, the LED should light up. If it does not light up, check your wiring carefully.
  2. Cut the sponge into two parts (square shapes).
  3. Soak one piece of sponge in tap water. Keep the other piece dry.
  4. Touch the wet sponge to the two free leads from resistors R1 and R2. What happens?
  5. Touch the dry sponge to the two free leads from resistors R1 and R2. What happens?
  6. For your science fair display board, note that turning on the power to your circuit is equivalent to the sprinkler system's timer starting the sprinkler. The LED shows whether or not electricity is flowing. When the LED is on, the sprinkler would be on.

Saturday 4 July 2015

Catching Stardust

Introduction

comet structure
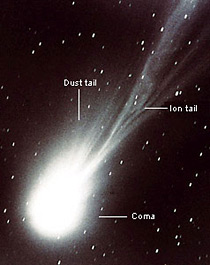
Here is an image of Halley's Comet showing the coma and tail structure (Yeomans, 2005).

In 2006, scientists at NASA got a very special delivery all the way from outer space. It was a package of space particles captured by the StarDust Mission, a satellite that had been sent into space 7 years earlier. StarDust's mission was to fly through the coma of the comet Wild 2 to capture some stardust, and then to send the capsule back home to earth where it could be studied by a team of scientists. The coma of a comet is near the nucleus and has a high density of dust, gas, and particles.
When the capsule landed in the desert of Utah in 2006, scientists were relieved to see the tiny space particles unharmed and ready to be studied. By studying the captured particles from the StarDust Mission, scientists will have seen some of the oldest particles in the universe (NASA JPL, 2007).
How did the satellite capture the particles? This satellite was designed with a special collection panel containing a special gel called "aerogel" that could trap the particles as they bombarded the panel (Figure 1a). The trace of each single particle could be seen in the aerogel where it hit the collection panel (Figure 1b). Then, each single particle could be cut out of the gel as a triangular slice and examined to find out what type of matter the particle was made of (Figure 1b).


StarDust satellite
Figure 1a.
many particles trapped in aerogel
Figure 1b.
comet particle in aerogel
Figure 1c.
Scientists at the NASA Jet Propulsion Laboratory devised a way to trap particles from the comet using a specially designed panel containing aerogel (1a). The aerogel material captures particles inside the gel (1b) so they can be later cut out of the gel and studied (1c) (Images from NASA JPL, 2007).
In this experiment, you will build your own mini satellite and use it to collect some pretend stellar debris. You will make your satellites out of a milk carton and use petroleum jelly to capture particles. Then you will use different lengths of string to hang your satellites at different distance from the ground, simulating different orbital distances. If you simulate an asteroid impact, how much stellar dust will your satellites collect? Will placing your satellite at different "orbital" distances from the impact change the amount of debris collected?

Terms and Concepts

To do this type of experiment you should know what the following terms mean. Have an adult help you search the Internet, or take you to your local library to find out more!
  • Satellite
  • Stardust
  • Particles
  • Orbit
  • Distance
Questions
  • How can a satellite be designed to collect particles from space?
  • How can a satellite be used to study astronomical phenomenon, like a meteor impact or a passing comet?
  • Does the distance of a satellite to an astronomical object affect the number of particles collected?

Bibliography

  • Read all about NASA's Stardust Mission to collect particles from the tail of a passing comet:
    NASA JPL, 2007. "Stardust - NASA's Comet Sample Return Mission," National Aeronautics and Space Administration (NASA), Jet Propulsion Laboratory, California Institute of Technology. [accessed September 6, 2007

Materials and Equipment

  • 1/2 gallon milk carton
  • Scissors
  • String
  • Vaseline (or other petroleum jelly product)
  • Volunteer
  • Face mask (like the kind used when painting a room)
  • Penny
  • Permanent marker
  • Clothes hanger
  • Meter stick
  • Ashes (from a fireplace or grill)
  • Large pan (or flat box)
  • Baseball

Experimental Procedure

  1. First, you will need to build your satellites, one for each distance you will test. In this procedure I describe using three satellites, but you can build more. This procedure describes a simple design for a mini satellite you can build using a milk carton
  2. Cut one side of the milk carton box off using scissors. Cut the piece of milk carton into three rectangles of the same size:


  3. Cut a slit in each rectangle, halfway down the center of the rectangle. Draw a circle on each "wing" on the white side of the rectangle using the permanent marker and a penny as your guide. You should end up with 2 equal-sized circles on each rectangle:


  4. Assemble the two pieces into a mini-satellite. Tie a string around the center of the satellite for hanging.


  5. Repeat steps 2-4 to make three (or more) total satellites.
  6. Prepare your satellite mounting device (a clothes hanger) for your volunteer to hold for you. Hang each of your satellites from a clothes hanger at different lengths using the attached strings. One satellite should be on a short string (about 10 cm), the next on a medium sized string (about 50 centimeters), and the last on a long string (about 100 cm or 1 meter). If you are using more than three satellites, just change your measurements accordingly.
  7. Next, you will need to set up your crater impact simulation. This experiment is very dusty and messy, so you will need to set up your simulation outdoors. Also, you will need to bring your volunteer to help you hold your satellites during the "meteor" impact. Your back yard would be a good place to set up your simulation site.
  8. Place a tray or shallow box on the ground at your test site.
  9. Fill the shallow tray or box with ash from your fireplace or grill. If you do not have any, you can substitute any light, dusty powder in place of the ash like: chalk, talcum powder, etc. Allow all of the ash to settle and do not disturb the ash until you are ready for your experiment.
  10. Smear a layer of petroleum jelly (Vaseline) on each circle of your satellite. The jelly will collect particles by sticking to them. You should have four jelly-smeared collection circles on each satellite. NOTE: It is very important to protect your satellites after this step, so that you do not accidentally contaminate the jelly-smeared circles with debris. Try and keep them clean until you do the simulation!
  11. Have your volunteer put on a face mask and hold the satellite hanger above, but not touching, the surface of the ash. Explain to your volunteer what you will do in the next step (so they won't freak out) and tell them to hold very still.


  12. After a countdown, throw a "meteor" (a hard object such as a baseball) into the pile of ash, causing a "crater impact" and sending up a cloud of "stardust" around the impact crater.
  13. After the dust settles you can tell your volunteer to give you the satellite hanger, and be sure to thank them for doing such a great job.
  14. Using a digital camera, photograph each collection circle (4 total) for each satellite using the digital micro setting on your camera. Here is an example of the three photos I took for my experiment:

    10cm string
    (10cm string) 50cm string
    (50cm string) 100cm string
    (100cm string)


    Examples of my collection circles at varying distances from a minisatellite: farthest from the impact on the shortest string (10cm), at a medium distance from the impact on a medium length string (50cm), and nearest the impact on a long string (100cm).
  15. Once you take your pictures, you can repeat the experiment and collect more data by wiping off the petroleum jelly COMPLETELY and starting again at step 10.
  16. Now you can analyze the data. Open each photo in a digital photo editor, like iPhoto or Adobe Photoshop. Count the total number of particles in each circle, and write the data in a table:
    Satellite Orbit Distance (cm)Number of Particles Counted in Each CircleAverage Number of Particles Collected
    Circle #1Circle #2Circle #3Circle #4
    10 cm     
    50 cm     
    100 cm     
  17. Calculate the average number of particles for each satellite orbit distance by adding together all of your data (in this case, circles 1-4) and dividing by the number of data points (4). Write your answer in the final column of the data table.
  18. Make a bar graph of your data. Make a scale for the "Average Number of Particles Collected" on the left side of the graph (y-axis). Draw one bar for each satellite orbit distance you tested, and label each bar on the bottom (x-axis) of the graph.
  19. What do your results mean? Does the average number of particles collected increase or decrease with orbit distance? What conclusion can you make about this?